In some cases the transfer function between the measured physical parameter (for example the temperature) and the output voltage of the sensor is unknown or difficult to calculate from the component datasheet.
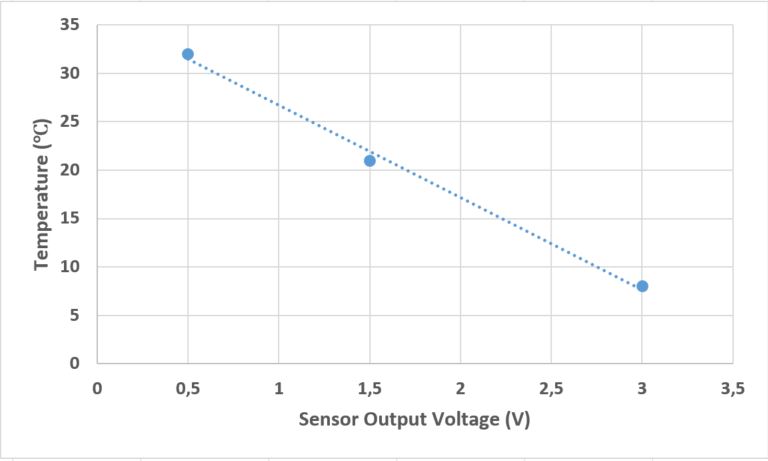
A simple method to determine the transfer function f.ex. of a temperature sensor, is to measure the output voltage at some (3-4) specific temperatures, plot the result into a graph as the one shown below to the right and find the transfer function by regression.
For our specific NTC sensor we can assume that the relationship is linear within the range of interest. Linear regression can be used to find the linear equation of best fit.
Linearity means that the relation between voltage and the parameter (f.ex. temperature) can be expressed by the linear formula:

or in our case
Parameter (f.ex. temperature) = A ⋅ Voltage + B,
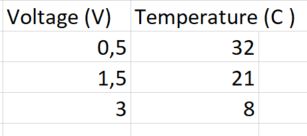
The graph can be used to estimate the values of A and B. In this diagram you can plot the measured voltages on the x-axis, and the parameter (in this case temperature) on the y-axis. In the table below the diagram you will find some example measurements for this sensor. These measurements are also plotted in the graph. Step two is to draw a straight line through the points. Use the features in your CAS-tool (f.ex. Excel, TiNspire, …) to do this to get the most accurate result. The more points you use the more accurate your result will be. Use it to determine the values of A and B from the standard linear formula above.
A: is the slope of the line,
B: is the intersection with the y-axis.