After finishing the CanSat Shield board you need to test it to make sure that all of the components are working properly. The following steps will guide you through the test procedure:
1. Install the Shield board on top of Arduino Uno (Make sure the power is disconnected before mounting the Shield board).
2. Power up the CanSat by connecting the battery. There is a green light on the Arduino Uno labelled «ON». This should always be illuminated when the Arduino Uno is powered on. If you fail to get the power light on, test your battery and also make sure there are no short circuits on the Shield board.
3. Disconnect the battery, then connect the USB cable and check the “ON” light again.
4. Open a new Arduino Sketch and insert code text from this link: shieldtest. Name this new sketch «ShieldTest.ino». Or if already done so: open the sketch file «ShieldTest.ino» in the Arduino IDE (1.0 or later version) and upload the sketch to the Arduino Uno board. This is a test program designed to give you measurements from all the sensors on the CanSat kit.
5. Start the «Serial Monitor» in the Arduino IDE.
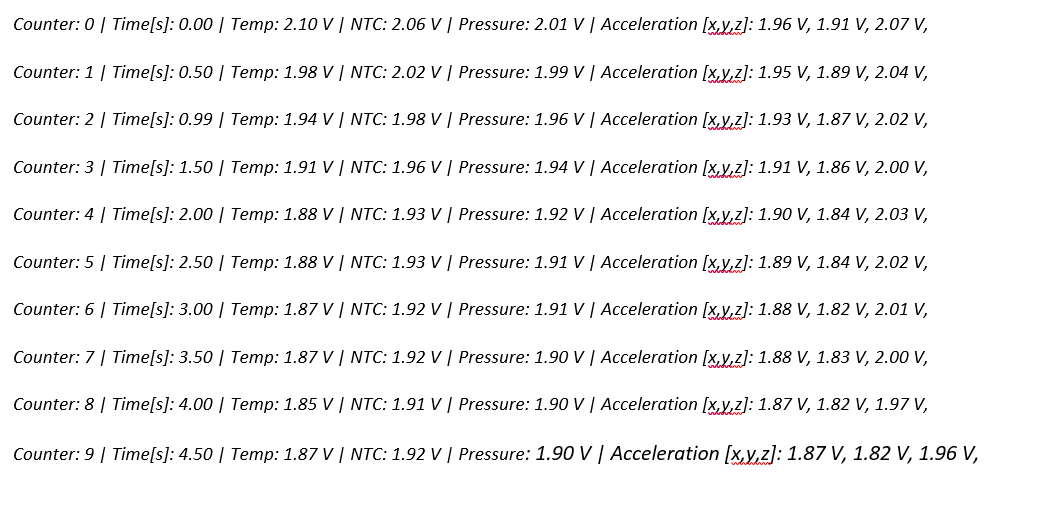
You should get some data similar to what you see in the illustration to the right.
6. Description of the measured data
| Counter: | This will count the number of measurements done by the CanSat. |
| Time: | This is the time in seconds since the CanSat was turned on. |
| Temp: | Shows data from the first temperature sensor (LM35DZ). |
| NTC: | Shows data from the optional temperature sensor (NTC). |
| Pressure: | Shows data from the pressure sensor (MPX4115A). |
| Acceleration: | Show data from the accelerometer (MMA7361L). This sensor will give you tree readings, one for each axis (x, y and Z). |
7. The test program can be controlled by sending a character via the serial monitor. Enter a character at the command line and press enter. The test program will accept the following commands:
| “1” | Sets the sampling speed to 1 Hz (1 per second). |
| “2” | Sets the sampling speed to 2 Hz (2 per second). |
| “5” | Sets the sampling speed to 5 Hz (5 per second). |
| “R” | Resets the counter back to zero. |
| “V” | Changes all the sensor outputs to volts. |
| “S” | Changes all the sensor outputs to measured values in Celsius, Pascal and G (9,81N). |
8. Test all the sensors by trying to manipulate the sensors.
Do you get response from all the sensors?
9. Test the accelerometer setting. Put a shunt (jumper) on the J1 port. This will regulate the sensitivity for the accelerometer from 3G to 9G (or from 1,5G to 6G depending of what version of accelerometer you have installed). The output should be the same, but with a different resolution.
If you have got data from all the sensors and they seem to work fine the testing of the main functionality is done. The radio and data logger will be tested at a later point in this manual.
Note: The sensors may have some deviations from the actual conditions caused by offset in the sensors. There is a section on how to calibrate the sensor here.