Now that you have assembled the CanSat kit, we are ready to test the kit. In this article we will first load in a sketch to the Teensy, and do some simple testing with GPIOs and the ADC. After that we will test the Cansat kit itself with some of the onboard components.
Loading the first sketch
First, start by connect the Teensy board (which now is mounted to the Cansat PCB) by USB cable. We do not need any more power than USB for now (now battery needed). When plugging in the cable, the LED light on the Cansat PCB should light up. If not, please detach the board and problem-solve why. All computers have a fail safe that will demount a USB device if it draws too much power, so if you have a short-circuit, your computer will try to demount the Teensy device and you will normally need to do a reboot. This is what normally what should happen, at least.
When you imported the two Cansat related libraries into the Arduino IDE, some examples was automatically added. We will start be using these now. First, go to Files -> Examples and locate the Cansat_RFM96 sub-menu. There you will find the sketch called «Cansat_DigitalAndAnalog». Select this and upload it to the Teensy. Remember to configure the Arduino IDE to use the Teensy properly with the Tools -> Board and Tools -> Ports as you have already done in the «Getting started with the primary mission» chapter page. There is not need to alter this program before running it.
After a successfull upload, open the Serial Monitor by either pressing the magnifying glass icon on the top, right side of the IDE window or go to Tools -> Serial Monitor. The Serial monitor window will show you all the communication from the Teensy to the computer (not the other way around).
(For the advanced user merging from other Arduino boards: there is no need to change the baud rate in the Serial monitor due to the USB core communication on the Teensy boards, unlike on other Arduino boards which uses a UART to USB bridge which is baud rate dependent. The Teensy 3.5 is a true 15 Mbps USB device independent on the baud rate you set.)
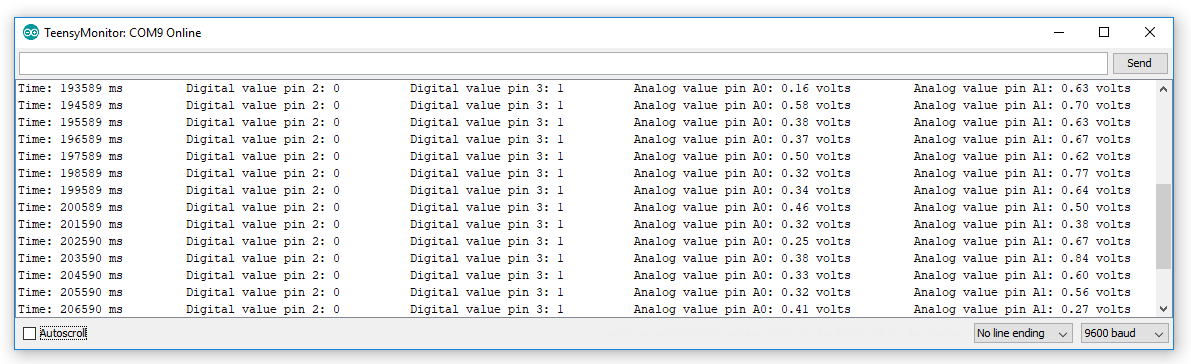
Text should now appear in the window similar as to in the figure below, with a new line every second. We output the time since the microcontroller started running in milliseconds, the value of the digital pins 2 and 3 and the voltage at pin A0 and A1 (already converted for us in the code).
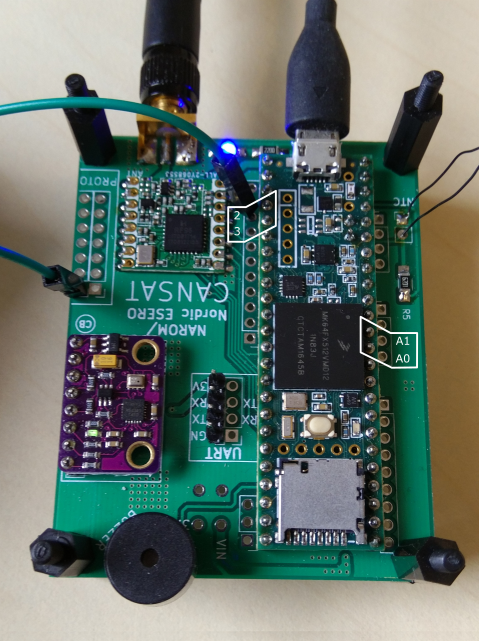
The Teensy board has many pins on the outer edges, and the all the pins on the Teensy that is available for your control (some of the pins are used by functions on the board and should never be used by the user) has an adjacent 0.1″ header pin. If you see closely you can see that these header pins (which should be unpopulated) are electrically connected to the pin closest to it on the Teensy. So whatever voltage you set on that pin, that is the voltage that the Teensy will measure. Take a jumper cable which should have been given to you by the tutor and take one line at the header pin marked 3.3V on the Cansat PCB and the other end on digital pin 2 and 3, and on the analog pin A0 and A1. See Figure 2. What happens with the values in Serial Monitor?
The digital pin 2 is configured as an input without so called pullup or pulldown resistors, but pin 3 is configured in software to have pullup. What that means is that, if nothing drives the line, meaning actively setting the voltage to something, the voltage will always be high (3.3 volts) since it is tied to a resistor with a high resistance to 3.3V. You might see the difference between the two when you connect a jumper cable between 3.3V and the two digital inputs 2 and 3. Actively setting 3.3V by you with the cable on pin 3 should make no difference to the output, it should just stay at 1 (logic high). Doing the same thing with pin 2, however, which do not have a pullup resistor, could make a difference. Dependent on multiple factors, the pin will always be logic high when you set the voltage to 3.3 volts with the cable, but might go to 0 when not being set by you (when not using the cable on the pin).
What happens when you set 0 V (there is a header pin marked with GND on the Cansat PCB, which means 0V power line) on pin 2 and 3? Try both, and also see what happens when you do the same with analog pin A0 and A1. What happens if you only touch A0 and A1 with your finger without using a cable? In some cases you can adjust the voltage level on the analog input, as all human bodies act as a capacitor (watching the voltage level from your finger on much higher sample rates than 1 Hz will show you rapid changes in voltage levels!).
Testing the Cansat components
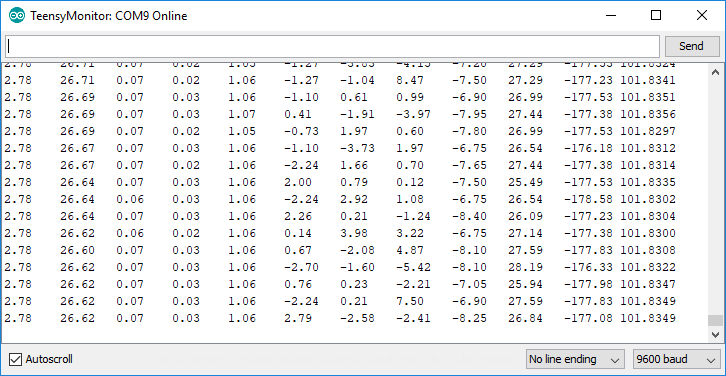
We will now try and read the sensors which you soldered on the board. As in the previous case, go to Files -> Examples and find the sketch called «Cansat_TestCB». This is a ready-made sketch that tests the onboard sensors. From the start, it outputs these values:
- Battery voltage (floating if no battery is connected)
- Temperature of the NTC sensor in centrigrades
- Accelerometer in x, y and z direction
- Gyroscope in x, y and z direction
- Magnetometer in x, y and z direction
- Pressure in hPa/mbar
To view the data, open Serial Monitor again to see the data streaming out over the USB port, ten lines pr second. See Figure 3.
But a new feature in Arduino is that you quite easily can plot! The format being output by the Cansat shield is in the format that the plotting tool wants. Close the Serial Monitor and open the Serial Plotter in the dropdown menu Tools. The problem with plotting all of these parameters is that they are quite difference. The pressure is around 100 and if you lift up and shake and turn the Cansat you will see that it is not easy to see all of the graphs at the same time, since they all share the same vertical axis. We need to do something about that, and we will do that next.
Close the Serial Plotter and scroll to the top of the sketch. You will see these lines close to the top:
#define USE_BUZZER         0
#define OUTPUT_TEMP        1
#define OUTPUT_VIN         1
#define OUTPUT_ACC         1
#define OUTPUT_GYRO        1
#define OUTPUT_MAG         1
#define OUTPUT_PRESSURE    1
These are precompiler flags that let you include or dont include parts of your code (in addition to a bunch of things, that we will not touch upon here). Set all of these to 0 instead of one except the one with OUTPUT_TEMP in it. This make the precompiler only include the part of the code that outputs the temperature, not output the other things. In the code, you can see what it will include or not include by these logical statements:
#if OUTPUT_TEMP == 1
    Serial.print(read_temp_direct());
    Serial.print("\t");
#endif
If you set
#define OUTPUT_TEMP 1
the precompiler will include the code, and if you change the 1 to a 0 like
#define OUTPUT_TEMP 0
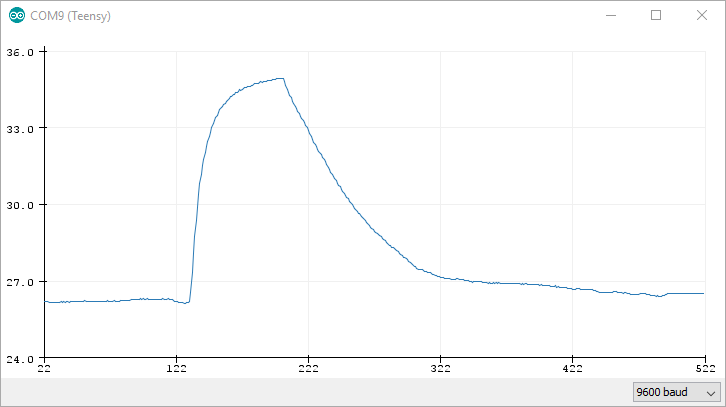
it will not include the code. This make it quite easy for you as a user to enable or disable some parts of the code, without knowing how the code works. So set all of the #define lines to 0 except the temperature line, and upload the sketch again. Make sure that you have closed the Serial Plotter window before uploading the code. After you have uploaded it, open the Serial Monitor and see that it is only one column of data streaming out pr line, and this should be the approximate temperature of the Cansat kit (the NTC sensor). Close down the Serial Monitor window and open the Serial Plotter. You should know see some variance in the data, and while touching the NTC sensor to heat it up, you should see great change in temperature. See Figure 4 as an example of this.
In some cases it can be better to view the data in the Serial Monitor as text and in others it can be better to plot. Often when viewed in Serial Monitor it can be better to output all the data at the same time, and most often it is better to output only a few things when using the Serial Plotter. Play around with this!
If you wonder what the x axis in the Serial Plotter is, its the number of samples it got since you opened it. So since we’re outputting at 10 Hz, its the number of seconds divided by ten since you opened the window.
Understanding the code
Lastly, we have made a fun, little quirk in the program. If you enable the USE_BUZZER flag with the line
#define USE_BUZZER 1
and open Serial Plotter and at the same time as outputting the temperature variable, what happens when you heat up the temperature sensor? Play around with this, and find out where and how this works in the sketch and where you can adjust the treshold.
Understanding code written by others is quite usefull, at least at the start. There are parts of the code that will be usefull for you to use later on, so it will be very good for you to spend some time trying to understanding this sketch, at least parts of it.