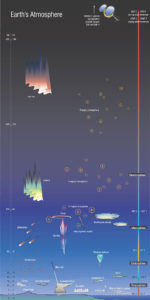
The atmosphere is all around us; it is a thin gaseous layer surrounding our planet. The atmosphere is composed primarily of nitrogen (78%) and oxygen (21%). The remaining 1% consists of water vapour, CO2 and other trace gasses. The Earth’s atmosphere consists of different layers, each one having different properties (temperatures, pressure, composition, etc…).
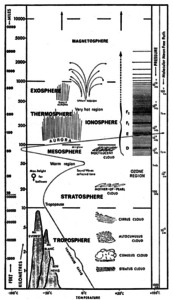
The different layers are represented in the two figures, along with various human and weather activities seen in these layers.
Unlike our CanSat, most satellites operate in the exosphere. Here the density of the atmosphere is very low. The CanSat however operates in the troposphere, which is the bottom layer of the atmosphere. This layer contains about 80% of the total mass of the atmosphere, and stretches to about 10 kilometres altitude. A great deal of the “weather” we observe on a day-to-day basis (wind and clouds for instance) occurs within this layer.
As seen in the figure to the right, the temperature and pressure of the atmosphere varies with altitude.
Although the ambient temperature can rise and fall as you move through the different layers of the atmosphere.
Within the troposphere, there is a linear relation between the temperature and altitude. On average, ascending one kilometre from sea level will result in a temperature drop of 6.5 degrees Celsius.
The equation below provides the relation:
with
– Temperature in Kelvin
– Starting temperature at
altitude
– Altitude in meters
– Starting altitude
– Temperature gradient:
.
The relation between the pressure and the altitude is somewhat more complicated. The pressure is not only dependent on the altitude but also on the temperature.
Let’s start with the relation of pressure to temperature:
with – Pressure in Pascal
– Start pressure in Pascal
– Gravitational acceleration: 9.81 m/s2
– Specific gas constant: 287.06 J/kg⋅K
Inserting this formula into the temperature-altitude relation, we achieve the following expression for altitude as a function of temperature and pressure:


